Application Note 14:Temperature Measurement with the LM-1
Thermistor basics
A lot of people want to measure medium temperatures like IAT and CT with the LM-1. The following document shows how to do that for temperatures between -50 deg C (-58 deg F) and ~200 deg C (400 deg F)
The devices of choice for these measurements are called NTC thermistors. NTC stands for Negative Temperature Coefficient. NTC thermistors are resistors whose resistance value gets lower with rising temperature. Unfortunately the resistance over temperature curve is non linear.
The exact resistance over temperature curve is dependent on the material used to manufacture the thermistors. Each material has a different curve.
Thermistors are usually specified by their resistance at 25 deg C (77 deg F) and the temperature curve. This curve or table shows the change in resistance relative to the resistance of the thermistor at 25 deg C (77 deg F).
Resistance curves for different materials can be found here:
www.thermometrics.com/htmldocs/ntcres.htm
NTC resistors can be found here:
Recommended part# is KC009G-ND
This thermistor has a resistance at 25 deg C of 10 kOhm. Material is GE9.7
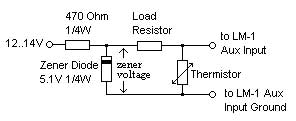
Circuit Diagram
The circuit is very simple. It just requires a thermistor, a zener diode and 2 resistors.
Calculation of Voltage/Temperature for LogWorks
Download this spreadsheet to calculate an output voltage curve for thermistors.
- In the column “Rth/R25”, enter the material data for the thermistor used. The spreadsheet is already filled out for the thermistor material GE9.7
- In the field G5, enter the nominal resistance of the thermistor at 25 deg C in kOhm.
- In the field G2, enter the value of the load resistor in kOhm.
- In the field G8, enter the zener voltage measured where indicated in the schematic above.
- In the field G11, enter the Dissipation constant for the thermistor. This constant indicates how many milliWatts is required to heat up the thermistor by 1 deg C. The current flowing through the thermistor will heat it up and therefore indicate a higher temperature that the actual measured temperature.
- In Field A1, enter “degC” for a Centigrade scale or “degF” for a Fahrenheit scale.
Column A and B are then show the output voltage/temperature curve for the circuit.
Column D shows the error expected due to internal heating by the measurement current in deg C.
By reducing the load resistor you can shift the area of maximum sensitivity to higher temperatures. Do not reduce the load resistor below 0.5 kOhm.
After everything is set up, save the spreadsheet first in the normal .xls format. Then save it again in .dif format.
The resulting .dif file can be directly loaded in LogWorks in the Input Configuration/Load Edit Table custom setup for the appropriate input.